18 min readThe Manufacturing Workforce Crisis in Europe: 5 Levers That Actually Work in 2026
The European manufacturing workforce crisis is the convergence of five people-side pressures hitting producers from 5 to 500 employees at once: only 25% of manufacturing workers are engaged (Gallup), 32% of the 32 million European manufacturing workforce are aged 50-64 and will retire within 10-15 years (EIT Manufacturing), frontline managers have 29% advanced communication skill and drive 70% of team-engagement variance (Gallup / WGU), a 40-point gap between employer AI expectations and worker AI readiness threatens compliance under EU AI Act Article 4 (OECD / Randstad), and 83% of frontline workers cannot be reached by email (CultureMonkey). This pillar maps all five, shows the 5-lever fix that works without Enterprise-grade budgets, and links the sub-topics every producer has to own in the next 18 months.


![Employee Engagement: Why Surveys Fail and What Actually Works [2026]](https://www.teamazing.com/wp-content/uploads/2026/04/employee-enagagment-surveys-fail.jpg)

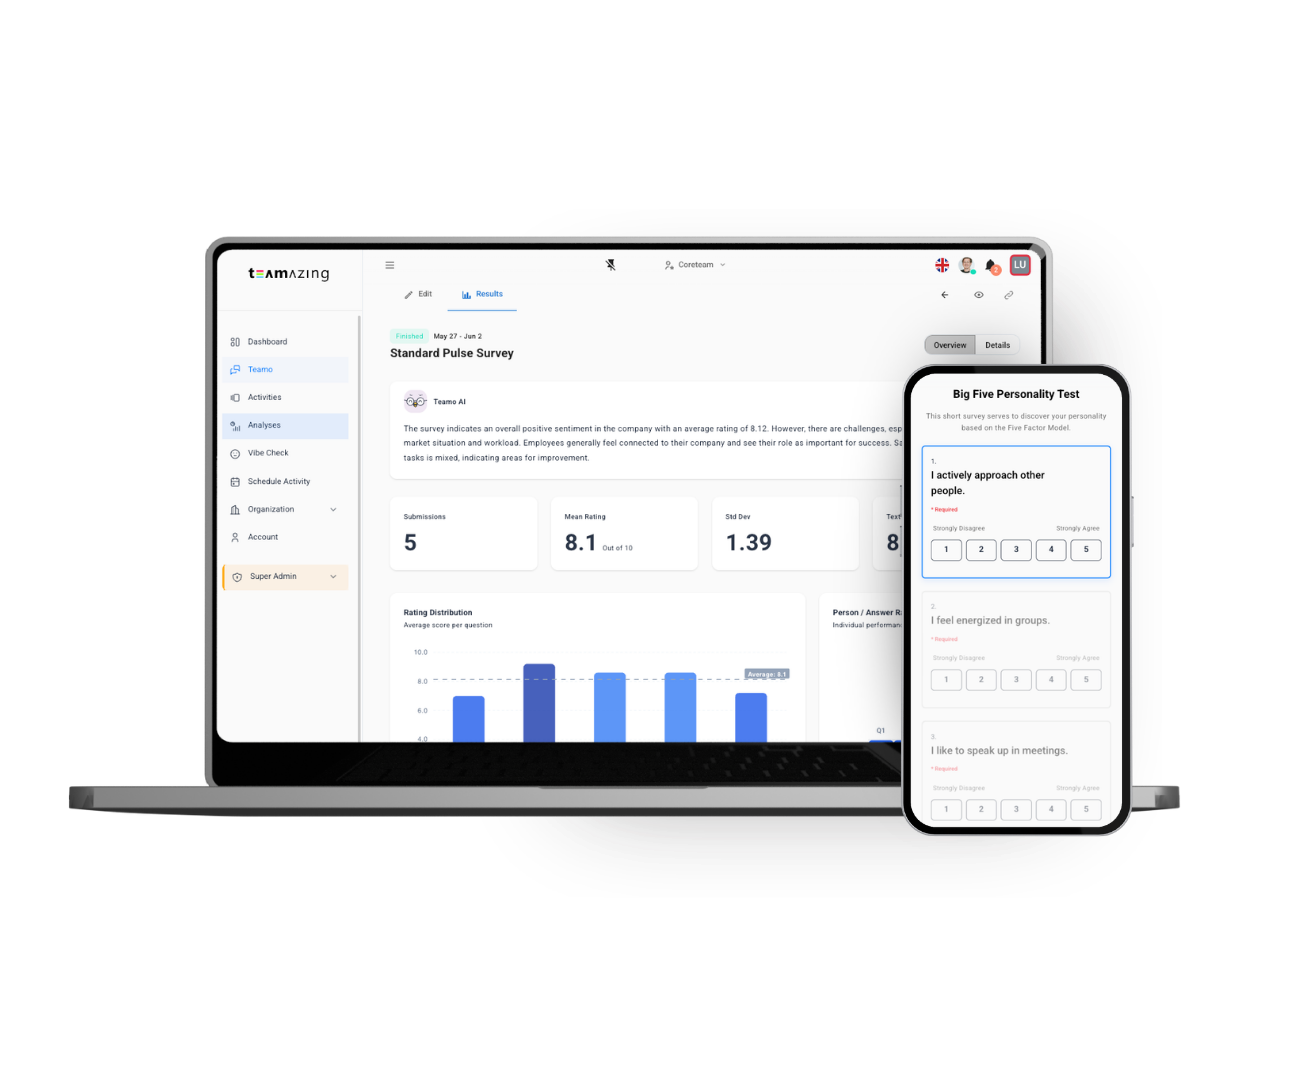
![People Analytics: The Complete Guide to Data-Driven Team Development [2026]](https://www.teamazing.com/wp-content/uploads/2026/04/ai-team-assesment.jpg)