


Customer Interview Questions: 25 Questions That Get Honest Answers [2026]
25 customer interview questions for three occasions, the five rules that keep answers honest, and how to run interviews at scale when you cannot do 50 calls.

Send a 3-minute survey to your team 1-2 weeks after the team building event. AI compares the responses to the pre-event baseline and shows exactly which dimensions improved, which stayed the same, and by how much. Turn team building from a feel-good expense into a measurable investment.
Create Post-Event Survey FreeThe change per dimension between the pre-event baseline and the post-event measurement. A delta of +1.0 on a 10-point scale across a dimension is meaningful; +2.0 or more is strong evidence of impact.
With enough respondents the AI tests whether the observed change is large enough to be unlikely by chance. Statistically significant deltas can be defended in front of stakeholders; small deltas should be framed as directional only.
The time between the event and the post-event survey. 1-2 weeks captures the strongest signal; beyond 6 weeks, normal team dynamics dilute the measurable effect of the event itself.

I've analyzed the results and summarized the key themes — with actionable recommendations for your team.
A team building impact measurement is a short survey sent to all participants 1-2 weeks after a team building event, offsite, or workshop. It captures the team state after the intervention across the same dimensions measured in the pre-event survey: communication quality, trust, collaboration satisfaction, conflict handling, and belonging. AI then compares both snapshots and shows the change per dimension.
Most teams stop measuring once the event is over. The result: no evidence of impact, and team building remains a gut-feeling line item in the budget. The after-event survey closes that loop. With the pre/post comparison, you can see exactly which dimensions improved, by how much, and whether the change is large enough to be meaningful. This turns team building into a measurable investment with hard data for stakeholders.
Start using this template for freeStop relying on "it felt great" feedback. The post-event survey produces hard numbers: dimension scores before and after, with statistical significance flags. Share with leadership to justify the team building investment with data.
Only 25% of organizations measure team building outcomes. With pre/post measurement, the ROI of approximately $4 per $1 invested becomes visible and defendable.
Not every dimension will improve equally. The after-event report shows which themes are still gaps. Plan follow-up sessions or coaching specifically for those remaining areas instead of repeating the same generic format next time.
Teams that follow up on identified gaps within 90 days retain about 70% of the post-event uplift; teams that do not lose most of it within a quarter.

Send the same survey link 1-2 weeks after the event. Same 3 minutes, same anonymity. Reusing identical questions is what makes the comparison valid; the AI handles matching and aggregation automatically.
Reusing the exact pre-event question wording is the single biggest driver of measurement validity. Even small wording changes can distort the comparison.
The methodology behind this template was distilled from preparing and running thousands of team-building projects over more than 12 years. The questions stay deliberately compact so the post-event measurement is light enough to actually get filled in.
AI as a bridge between 12 years of expert experience and modern analytics — interpreting before/after team data the way an experienced trainer would.
When the next budget cycle starts, you walk in with a chart instead of a story. Concrete deltas per dimension, statistical significance, and the open-text impact themes from the team are far more persuasive than anecdotal recap.
Hard pre/post deltas have been shown to increase team-development budget approval rates significantly compared to qualitative-only reports.
The post-event survey reuses exactly the same core questions as the pre-event survey so the comparison is valid. Three rating questions on a scale of 1-10 capture the team state after the event, and one open-text question collects how participants experienced the impact.
How satisfied am I with the current collaboration within our team?
Identical wording to the pre-event question, so the delta reflects actual change rather than question phrasing. AI compares both means and flags whether the difference is statistically meaningful.
How much do I trust the honest intentions of my teammates?
Trust is the slowest-moving dimension. A measurable improvement here 1-2 weeks after a single event is a strong signal that the work landed.
How strongly do I feel a sense of belonging to my team?
Belonging usually reacts fastest to a good team-building event. The post-event lift here, combined with reduced variance across responses, indicates the event integrated the group more tightly.
What changed for you in the team after the event?
The open-text question captures qualitative impact in the participants own words. AI groups responses into themes and shows which ones recur. Use these themes as supporting evidence for the quantitative deltas.
The after-event measurement only works if a pre-event baseline exists. If you have not run the pre-event survey, start there first — the after-event survey on its own gives only a current snapshot, not a measured change.
Share the survey link with all participants 1-2 weeks after the event. Same 3 minutes, same anonymous responses, same questions. The 1-2 week window captures the strongest signal before everyday team dynamics dilute the effect.
As soon as enough post-event responses arrive, the AI computes the delta per dimension, checks statistical significance, and groups the open-text themes. The output is a comparison report you can share with stakeholders.
Dimensions that did not improve, or that improved less than others, are the natural focus areas for the next intervention. Use this data to plan a targeted follow-up instead of booking a generic team-building event next time.
Your free access to templates, survey tools, and results with ways to export anywhere.
Get Started Free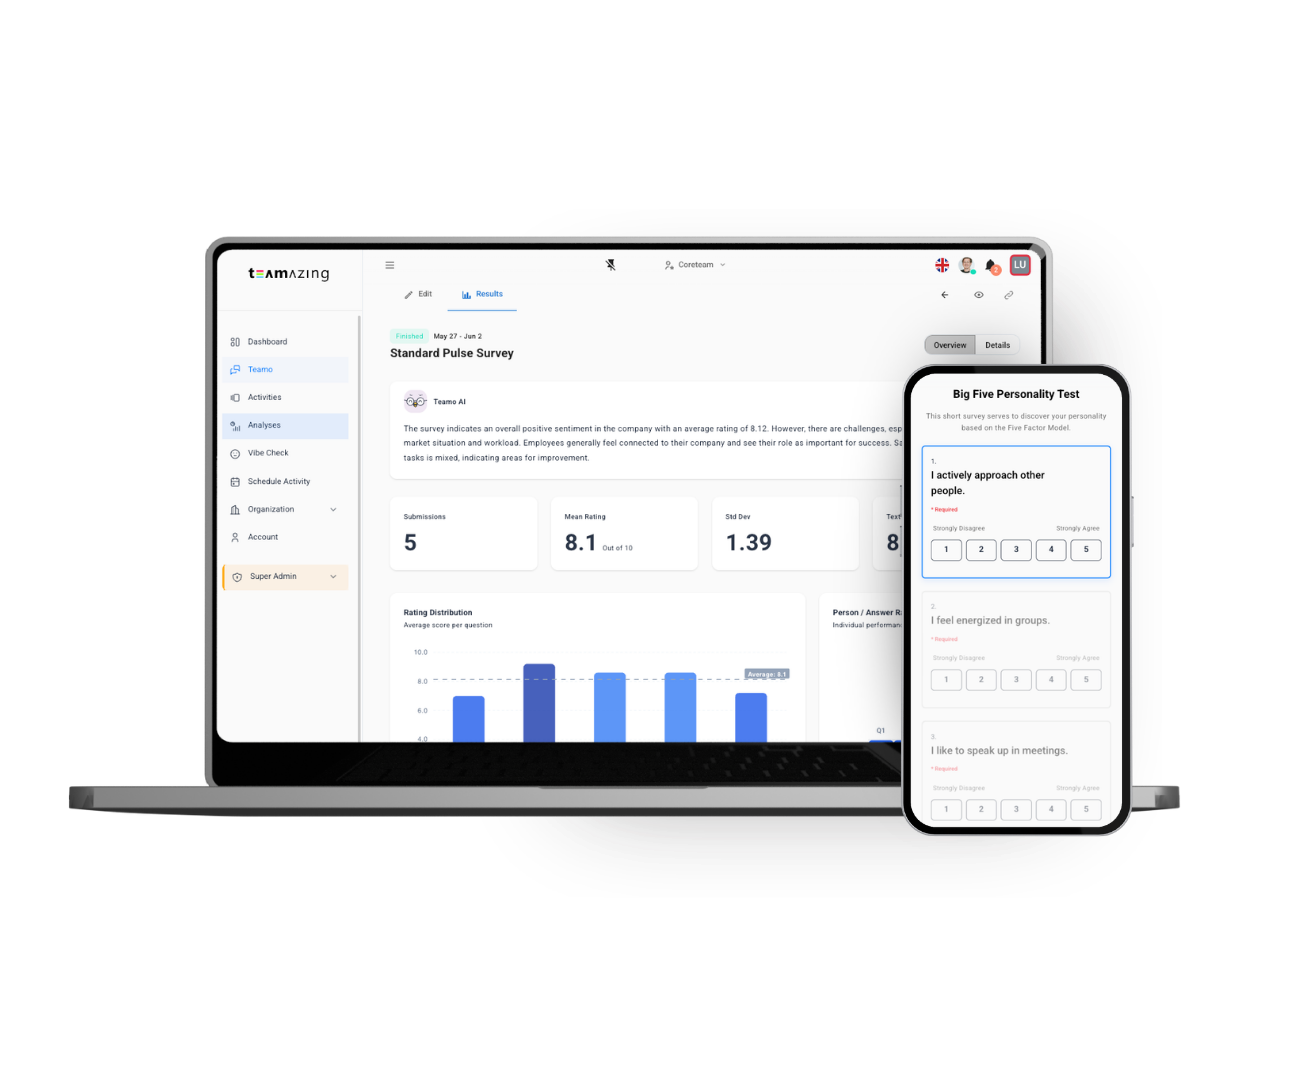
Teamo AI matches the post-event responses against the pre-event baseline automatically, flags statistically significant improvements, highlights dimensions that did not move, and groups the open-text impact themes. The result is a defendable before/after report you can present to leadership.
Select the After-Event Survey, link it to the same pre-event analysis, and send the link to all participants 1-2 weeks after the team building event, offsite, or workshop. 3 minutes, anonymous.
AI calculates the delta per dimension, flags significant changes, groups the qualitative impact themes, and produces a shareable report. No manual analysis needed.
Use the report as data for stakeholders and as the planning basis for the next intervention. Focus the next event on the dimensions that did not improve enough.
Find the right survey template for your team
Dive deeper with these guides
![Customer Interview Questions: 25 Questions That Get Honest Answers [2026]](https://www.teamazing.com/wp-content/uploads/2026/07/client-customer-interviews.jpg)
25 customer interview questions for three occasions, the five rules that keep answers honest, and how to run interviews at scale when you cannot do 50 calls.
![GDPR-Compliant Survey Tools: The Checklist That Actually Matters [2026]](https://www.teamazing.com/wp-content/uploads/2026/07/gdpr-surveys-and-tools.jpg)
What makes a survey tool GDPR compliant: the 7-point checklist (DPA, hosting, anonymity, retention), the Google Forms and SurveyMonkey question, and when anonymity solves most of it.
![Company Event Feedback Form: Template and 20 Questions That Show Whether It Worked [2026]](https://www.teamazing.com/wp-content/uploads/2026/07/company-event-feedback-form.jpg)
Company event feedback form with 20 questions, the two-measurement design, works council rules and the research on what team events actually change.
Create your Team Building Impact Measurement Survey in minutes — free with AI-powered analysis.
Use This Template Free